Computational Modeling with R
Week 1: Deterministic Modeling
In the opening session March 2, after guiding class members through the installation of R and the RStudio integrated development environment on their laptops, Ms. Mbuguiro presented an introduction to deterministic modeling. Each model considered was a mathematical explanation of a biological process of interest. “Deterministic” means that the output of the model depends solely on the precise values and conditions used as input for the model, and not on any variables that may have a random or other probabilistic distribution. The class recreated deterministic models – expressed in R – for drug delivery via nanoparticles and for bacteria grown in culture. We also explored fitting functions to our data – that is, optimizing a model to best account for our data – using the least squares method. Rather than writing code from scratch, we began by modifying short segments of existing code provided in the development environment. This enabled us to avoid trivial mistakes and permitted the focus to remain on gaining experience using mathematical concepts expressed in R to study a biological system.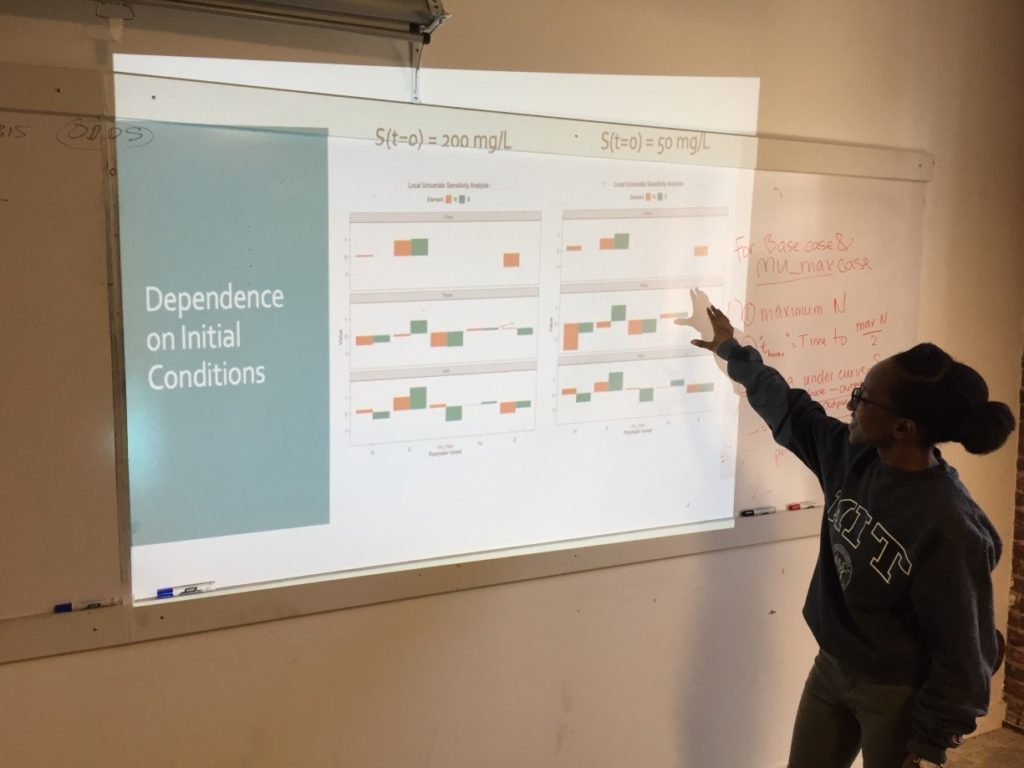
Week 2: Modeling growth rates
On the second Saturday, March 9, we explored using R for a common laboratory task: calculating the varying rate of change over time for a biological process involving a material of interest, and using the results to obtain a close estimate of the quantity of that material which is present at various time intervals. The varying rates of change are values of an ordinary differential equation. Using these values to obtain numerical approximations of the concentration of the material of interest at different points in time can be especially useful when direct analytic evaluation is difficult. In particular, the class focused on modeling the growth rate of bacterial colonies. We started with the essential relationship between the concentration of bacterial cells present and the growth rate of that cell concentration when there are no external constraints, such as limits on food supply. By calculating the rate of change in cell growth over very small changes in time using a species-specific growth rate constant and the concentration at the start of the time period, we were able to estimate the cell concentration at each incremental time point. When plotted, these cell concentration calculations formed a smooth curve that revealed exponential growth over the time sequence.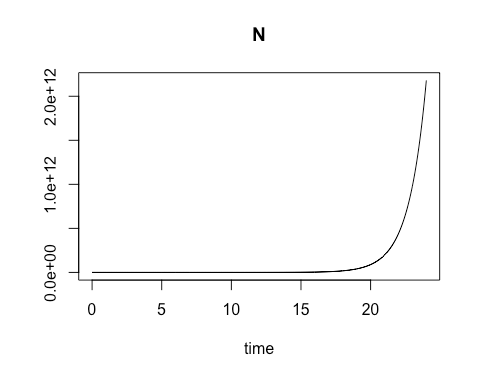
Week 3: Sensitivity Analysis
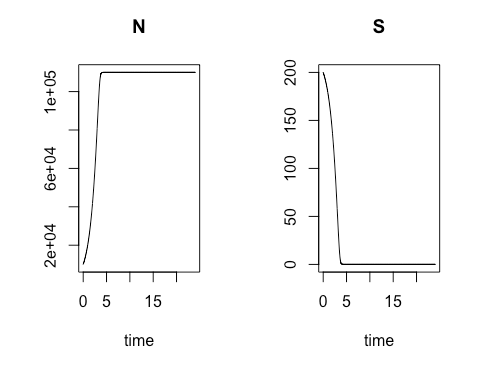
On the third Saturday, March 16, we conducted a sensitivity analysis on the Monod model of cell concentration increase and substrate depletion. Creating code in R for changing – one at a time –each relevant initial condition of the system and each rate-governing parameter, we explored the effect on the final outputs – cell concentration and substrate concentration – of a 10% change in each of the initial conditions and parameters. Looking at the effect of a 10% increase in the growth constant, we learned how to get a close estimate of the time required to reach half of the maximum cell concentration. As an illustration of how easily R can accommodate new functions to meet special needs, Ms. Mbuguiro wrote a “helper function” to find the position number within a sequence of time values of the particular value associated with a cell concentration that had reached 50% of the maximum. The calculation of all output changes driven by an incremental change of one input parameter is called a univariate sensitivity analysis. Extending our exploration of R for standard statistical manipulations, we normalized the outputs of the entire sensitivity analysis – that is, we converted the change in each output from an absolute measure into a measure that is relative to the 10% change of the growth constant. As a last step, the class wrote the R code to create a graphical representation of the normalized output for multiple univariate sensitivity analyses, showing the effect of 10% changes in various parameters, considered one at a time, upon properties associated with cell concentration (N) and with substrate concentration (S). These properties include: Cmax, the maximum cell or substrate concentration; Thmax, the time required to arrive at one half of Cmax; and the Area under Curve (AUC), a measure of concentration over time that can be used to calculate average concentration during the time period. The area under the curve for the substrate concentration is often used in drug development research as a measure of “exposure” to the substrate. As an aid to visualization, the class made use of another R “helper function” contributed by Ms. Mbuguiro called output_calculator2, which works in concert with other R functions to produce the final output.
About the Instructor
Wangui Mbuguiro is a Ph.D. candidate in the Biomedical Engineering Program at Johns Hopkins. Her research and passions center on engineering tools to better understand and treat menstrual disorders as part of the Computational Design of Therapeutics Lab. Outside of lab, Wangui enjoys encouraging scientific inquisition as an instructor and mentor at the Baltimore Underground Science Space, as well as building opportunities and community for underrepresented students in STEM at Johns Hopkins. Lastly, Wangui is a MIT alumna (B.S., Bioengineering, 2017), National Science Foundation Fellow, and friendly neighborhood scientist. You can connect with her on twitter (@WanguiMbuguiro) or LinkedIn.[1] Schoeberl, B. et al., Systems biology driving drug development: from design to the clinical testing of the anti-ErbB3 antibody seribantumab (MM-121). npj Systems Biology and Applications (2017) 3, 16034; doi:10.1038/npjsba.2016.34; published online 5 January 2017. [2] Hosseini, I. and Mac Gabhann, F., Mechanistic Models Predict Efficacy of CCR5-Deficient Stem Cell Transplants in HIV Patient Populations. CPT Pharmacometrics Syst. Pharmacol. (2016) 5, 82–90; doi:10.1002/psp4.12059; published online 16 February 2016. [3] Maier, R.M., Bacterial Growth. In Environmental Microbiology (Maier, R.M., Pepper, I.L., and Gerba, C.P., eds., 2nd ed., Academic Press, 2009), Ch. 3, p. 37-54. https://doi.org/10.1016/B978-0-12-370519-8.00003-1. (http://www.sciencedirect.com/science/article/pii/B9780123705198000031)